This Week’s News For Investors
Published Friday, June 23, 2023 at: 10:49 PM EDT

Here’s an analysis of this week’s economic news with perspective on how it affects investing
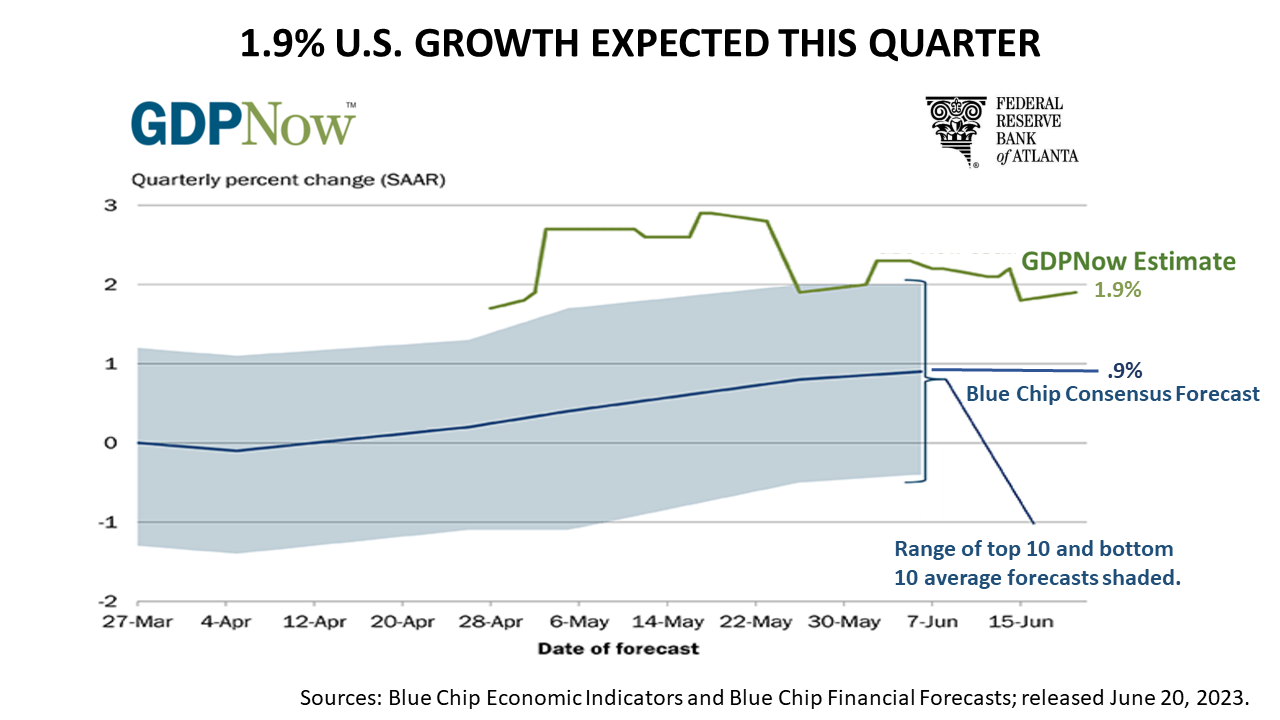
The Atlanta Federal Reserve Bank’s GDPNow forecast is substantially higher than the Blue Chip consensus forecast. A 1.9% growth rate for the current quarter, which ends in one week, would be a pretty terrific outcome.
The GDPNow forecast is an experimental tool the nation’s central bank branch in Atlanta sponsors to promote an understanding of what’s happening now in the economy. This attempt to forecast the growth of the U.S. economy in real-time is updated throughout every quarter. The same day that new data about manufacturing, jobs, inflation, and other economic fundamentals are released, the GDPNow forecast is updated. The GDPNow forecast is an algorithm-driven forecast, in contrast to the Blue Chip consensus forecast, which is a survey of economists. Since the pandemic, the GDPNow algorithm-driven forecast has been more accurate than humans. The algorithmic 1.9% forecast is much more optimistic than what economists expect.
The GDPNow-cast is a valuable tool in predicting economic trends, which are fundamental factors in stock prices. Here’s why: The growth rate of the U.S. for the second quarter will be released on July 27, but that will be an “advanced estimate.” The advanced estimate is subject to two revisions. The final growth rate of U.S. GDP will not be released until the end of the third quarter of 2023.
Sharing the GDPNow algorithm demonstrates the U.S. central bank’s commitment to transparency, innovation, and education. While the importance of GDPNow is not easy to grasp, the Fed publishes data beneficial to American investors, business owners and the rest of the world -- but the “Now-cast” is an experiment and not always accurate.
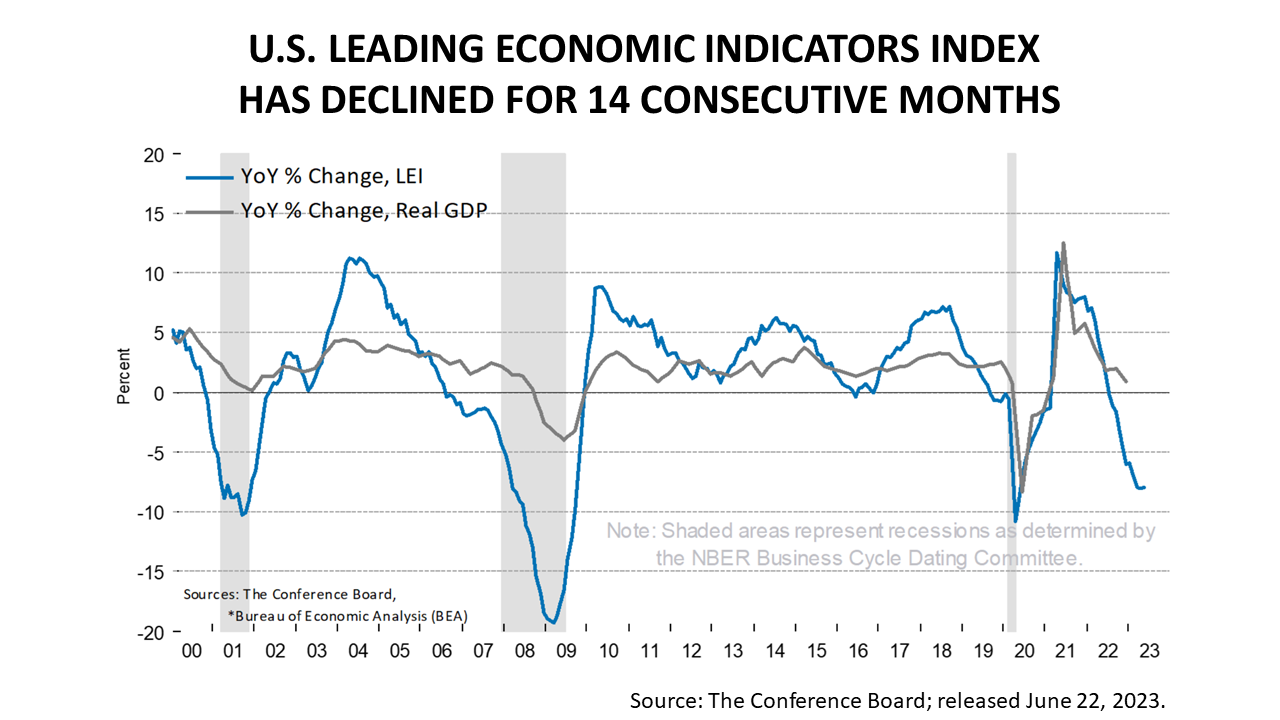
On Thursday, June 22, 2023, The Conference Board said the U.S. Leading Economic Indicators Index (LEI) in May declined for the 14th month in a row. A collapse in the LEI presaged every recession in modern history. And that’s not the only recession signal flashing.
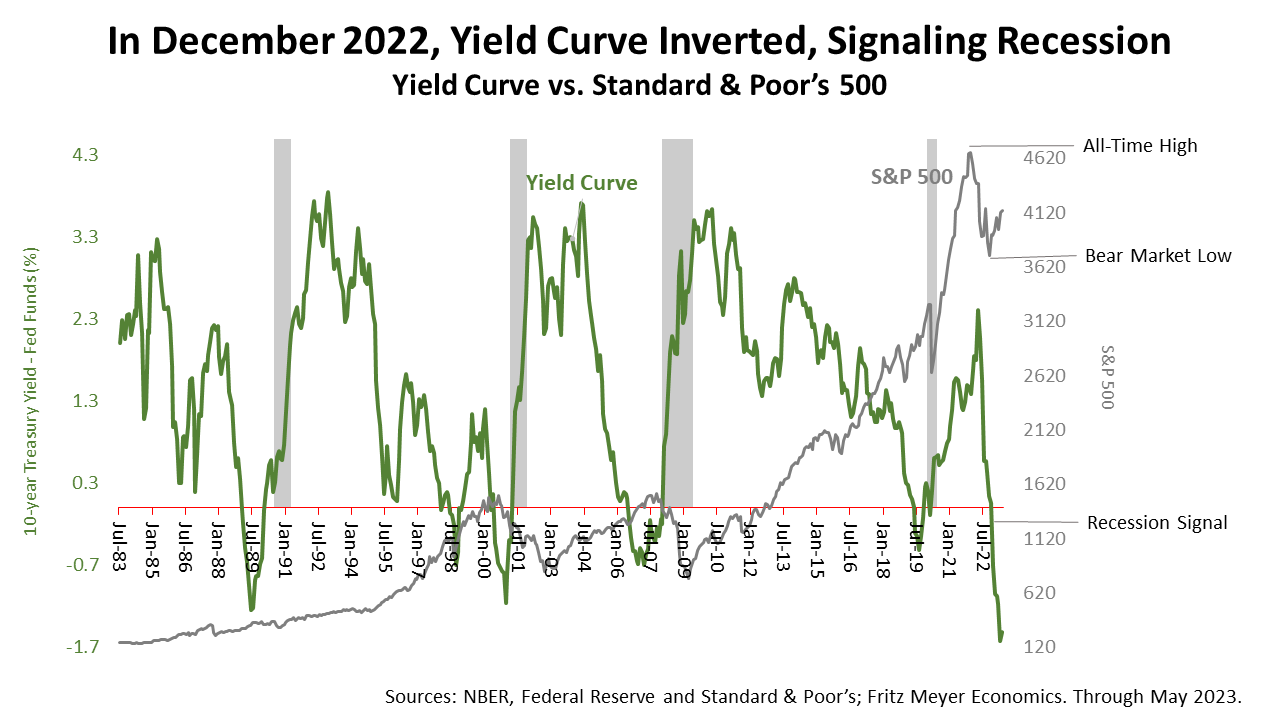
The green line in this chart shows yield curve has been less than zero since December 2022. A negative yield curve historically is a reliable precursor to a recession.
The yield curve is the interest rate on the 10-year Treasury bond minus the Federal Reserve’s funding rate. The Fed funding rate is what the U.S. government central bank charges money-center banks to borrow.
When the yield curve has inverted in the past, the economy usually turned down and receded with a lag of a year or more. At -1.51%, the yield curve is more inverted than at any time in four decades. But this time things are different.
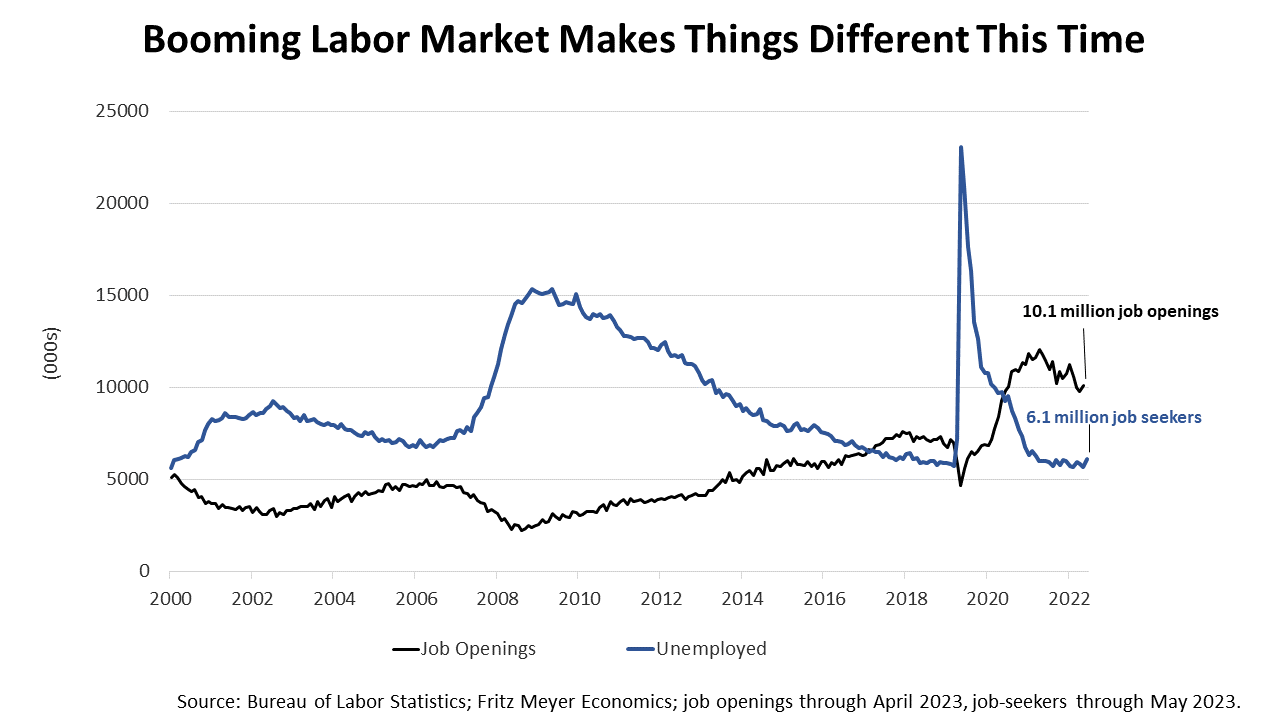
There are so many more job openings than job seekers. For each job seeker, there are nearly two job openings available. This is a powerful driving force. It may enable the U.S. to power through this period of higher short-term interest rates. While the yield curve historically is a very reliable indicator of a recession, it may not be accurate in this economic cycle because of the unusually strong demand for workers.
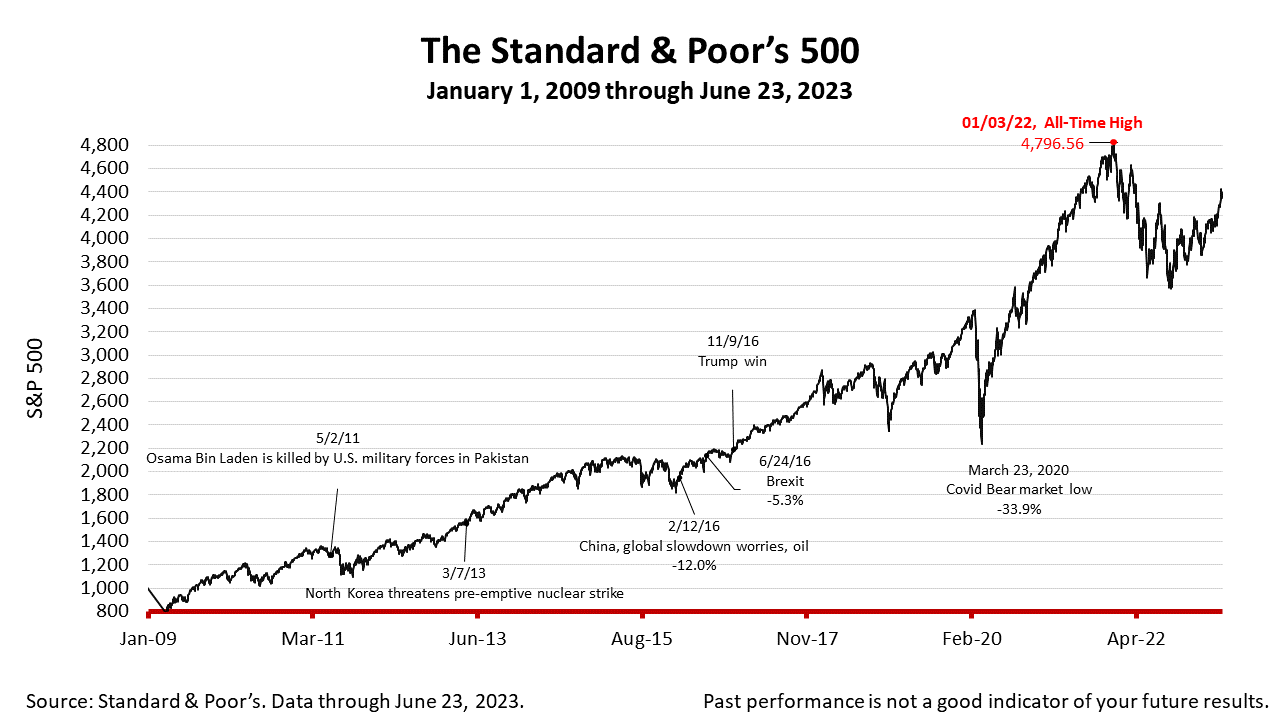
The Standard & Poor’s 500 stock index closed Friday at 4348.33, down -0.77% from Thursday, and down -0.92% from a week ago. The index is up +94.35% from the March 23, 2020, bear market low and -9.34% lower than its January 3, 2022, all-time high.
The Standard & Poor's 500 (S&P 500) is an unmanaged group of securities considered to be representative of the stock market in general. It is a market-value weighted index with each stock's weight proportionate to its market value. Index returns do not include fees or expenses. Investing involves risk, including the loss of principal, and past performance is no guarantee of future results. The investment return and principal value of an investment will fluctuate so that an investor's shares, when redeemed, may be worth more or less than their original cost. Current performance may be lower or higher than the performance quoted.
Nothing contained herein is to be considered a solicitation, research material, an investment recommendation, or advice of any kind, and it is subject to change without notice. Any investments or strategies referenced herein do not take into account the investment objectives, financial situation or particular needs of any specific person. Product suitability must be independently determined for each individual investor. Tax advice always depends on your particular personal situation and preferences. You should consult the appropriate financial professional regarding your specific circumstances.
The material represents an assessment of financial, economic and tax law at a specific point in time and is not intended to be a forecast of future events or a guarantee of future results. Forward-looking statements are subject to certain risks and uncertainties. Actual results, performance, or achievements may differ materially from those expressed or implied. Information is based on data gathered from what we believe are reliable sources. It is not guaranteed as to accuracy, does not purport to be complete, and is not intended to be used as a primary basis for investment decisions.
This article was written by a professional financial journalist for Advisor Products and is not intended as legal or investment advice.
This article was written by a professional financial journalist for Seneca Financial Advisors LLC and is not intended as legal or investment advice.
©2023 Advisor Products Inc. All Rights Reserved.
